Data Mining: Finding Similar Items and Users

How to find related items? Here are recipes based on really simple formulas. If you pay attention, this technique is used all over the web (like on Amazon) to personalize the user experience and increase conversion rates. Because we want to give kick-ass product recommendations.
To get one question out of the way: there are already many available libraries that do this, but as you’ll see there are multiple ways of skinning the cat and you won’t be able to pick the right one without understanding the process, at least intuitively.
Defining the Problem #
To find similar items to a certain item, you’ve got to first define what it means for 2 items to be similar and this depends on the problem you’re trying to solve:
- on a blog, you may want to suggest similar articles that share the same tags, or that have been viewed by the same people viewing the item you want to compare with
- Amazon has this section called “customers that bought this item also bought”, which is self-explanatory
- a service like IMDB, based on your ratings, could find users similar to you, users that liked or hated approximately the same movies you did, thus giving you suggestions on movies you’d like to watch in the future
In each case you need a way to classify these items you’re comparing, whether it is tags, or items purchased, or movies reviewed. We’ll be using tags, as it is simpler, but the formula holds for more complicated instances.
Redefining the Problem in Terms of Geometry #
We’ll be using my blog as sample. Let’s take some tags:
["API", "Algorithms", "Amazon", "Android", "Books", "Browser"]
That’s 6 tags. Well, what if we considered these tags as dimensions in a 6-dimensional Euclidean space? Then each item you want to sort or compare becomes a point in this space, in which a coordinate (representing a tag) is either one (tagged) or zero (not tagged).
So let’s say we’ve got one article tagged with API and Browser. Then its associated point will be:
[ 1, 0, 0, 0, 0, 1 ]
Now these coordinates could represent something else. For instance they could represent users. If say you’ve got a total of 6 users in your system, 2 of them rating an item with 3 and 5 stars respectively, you could have for the article in question this associated point (do note the order is very important):
[ 0, 3, 0, 0, 5, 0 ]
So now you can go ahead and calculate distances between these points. For instance you could calculate the angle between the associated vectors, or the actual euclidean distance between the 2 points. For a 2-dimensional Euclidean space, here’s how it would look like:
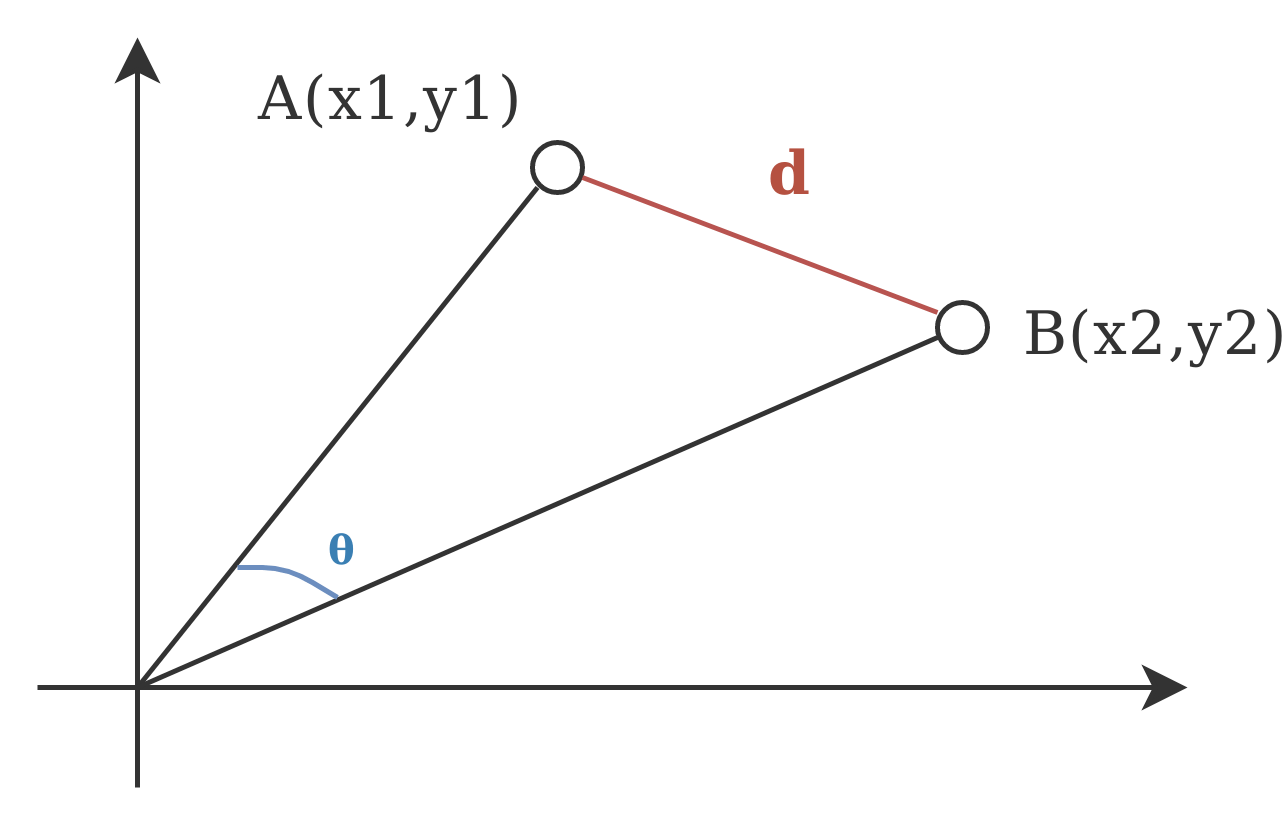
Euclidean Distance #
The mathematical formula for the Euclidean distance is really simple. Considering 2 points, A and B, with their associated coordinates, the distance is defined as:
The lower the distance between 2 points, then the higher the similarity. Here’s some Ruby code:
# Returns the Euclidean distance between 2 points
#
# Params:
#  - a, b: list of coordinates (float or integer)
#
def euclidean_distance(a, b)
  sq = a.zip(b).map{|a,b| (a - b) ** 2}
  Math.sqrt(sq.inject(0) {|s,c| s + c})
end

# Returns the associated point of our tags_set, relative to our
# tags_space.
#
# Params:
#  - tags_set: list of tags
#  - tags_space: _ordered_ list of tags
def tags_to_point(tags_set, tags_space)
  tags_space.map{|c| tags_set.member?(c) ? 1 : 0}
end

# Returns other_items sorted by similarity to this_item
# (most relevant are first in the returned list)
#
# Params:
#  - items: list of hashes that have [:tags]
#  - by_these_tags: list of tags to compare with
def sort_by_similarity(items, by_these_tags)
  tags_space = by_these_tags + items.map{|x| x[:tags]}
  tags_space.flatten!.sort!.uniq!

  this_point = tags_to_point(by_these_tags, tags_space)
  other_points = items.map{|i|
    [i, tags_to_point(i[:tags], tags_space)]
  }

  similarities = other_points.map{|item, that_point|
    [item, euclidean_distance(this_point, that_point)]
  }

  sorted = similarities.sort {|a,b| a[1] <=> b[1]}
  return sorted.map{|point,s| point}
end
And here is the test you could do, and btw you can copy the above and the bellow script and run it directly:
# SAMPLE DATA

all_articles = [
  {
   :article => "Data Mining: Finding Similar Items",
   :tags => ["Algorithms", "Programming", "Mining",
     "Python", "Ruby"]
  },
  {
   :article => "Blogging Platform for Hackers",
   :tags => ["Publishing", "Server", "Cloud", "Heroku",
     "Jekyll", "GAE"]
  },
  {
   :article => "UX Tip: Don't Hurt Me On Sign-Up",
   :tags => ["Web", "Design", "UX"]
  },
  {
   :article => "Crawling the Android Marketplace",
   :tags => ["Python", "Android", "Mining",
     "Web", "API"]
  }
]

# SORTING these articles by similarity with an article
# tagged with Publishing + Web + API
#
#
# The list is returned in this order:
#
# 1. article: Crawling the Android Marketplace
#    similarity: 2.0
#
# 2. article: "UX Tip: Don't Hurt Me On Sign-Up"
#    similarity: 2.0
#
# 3. article: Blogging Platform for Hackers
#    similarity: 2.645751
#
# 4. article: "Data Mining: Finding Similar Items"
#    similarity: 2.828427
#

sorted = sort_by_similarity(
    all_articles, ['Publishing', 'Web', 'API'])

require 'yaml'
puts YAML.dump(sorted)
The Problem (or Strength) of Euclidean Distance #
Can you see one flaw with it for our chosen data-set and intention? I think you can - the first 2 articles have the same Euclidean distance to [“Publishing”, “Web”, “API”], even though the first article shares 2 tags with our chosen item, instead of just 1 tag as the rest.
To visualize why, look at the points used in calculating the distance for the first article:
[1, 0, 0, 0, 0, 0, 0, 0, 0, 0, 1, 0, 0, 0, 0, 1]
[1, 0, 1, 0, 0, 0, 0, 0, 1, 0, 0, 1, 0, 0, 0, 1]
So 4 coordinates are different. Now look at the points used for the second article:
[1, 0, 0, 0, 0, 0, 0, 0, 0, 0, 1, 0, 0, 0, 0, 1]
[0, 0, 0, 0, 1, 0, 0, 0, 0, 0, 0, 0, 0, 0, 1, 1]
Again, 4 coordinates are different. So here’s the deal with Euclidean distance: it measures dissimilarity. The coordinates that are the same are less important than the coordinates that are different. For my purpose here, this is not good - because articles with more tags (or less) tags than the average are going to be disadvantaged.
Cosine Similarity #
This method is very similar to the one above, but does tend to give slightly different results, because this one actually measures similarity instead of dissimilarity. Here’s the formula:
= \frac{A \cdot B}{\|A\| \|B\|}= \frac{ \displaystyle\sum_{i=1}^{n} A_i B_i }{ \sqrt{ \displaystyle\sum_{i=1}^{n} A_i^2 } \sqrt{ \displaystyle\sum_{i=1}^{n} B_i^2 } }")
If you look at the visual with the 2 axis and 2 points, we need the cosine of the angle theta that’s between the vectors associated with our 2 points. And for our sample it does give better results.
The values will range between -1 and 1. -1 means that 2 items are total opposites, 0 means that the 2 items are independent of each other and 1 means that the 2 items are very similar (btw, because we are only doing zeros and ones for coordinates here, this score will never get negative for our sample).
Here’s the Ruby code (leaving out the wiring to our sample data, do that as an exercise):
def dot_product(a, b)
  products = a.zip(b).map{|a, b| a * b}
  products.inject(0) {|s,p| s + p}
end

def magnitude(point)
  squares = point.map{|x| x ** 2}
  Math.sqrt(squares.inject(0) {|s, c| s + c})
end

# Returns the cosine of the angle between the vectors
#associated with 2 points
#
# Params:
#  - a, b: list of coordinates (float or integer)
#
def cosine_similarity(a, b)
  dot_product(a, b) / (magnitude(a) * magnitude(b))
end
Also, sorting the articles in the above sample gives me the following:
- article: Crawling the Android Marketplace
  similarity: 0.5163977794943222

- article: "UX Tip: Don't Hurt Me On Sign-Up"
  similarity: 0.33333333333333337

- article: Blogging Platform for Hackers
  similarity: 0.23570226039551587

- article: "Data Mining: Finding Similar Items"
  similarity: 0.0
Right, so much better for this chosen sample and usage. Ain’t this fun? BUT, you guessed it, there’s a problem with this too …
The Problem with Our Sample; The Tf-Idf Weight #
Our data sample is so simple that we could have simply counted the number of common tags and use that as a metric. The result would be the same without getting fancy with Cosine Similarity :-)
Clearly a tag such as “Heroku” is more specific than a general purpose tag such as “Web”. Also, just because Jekyll was mentioned in an article, that doesn’t make the article about Jekyll. Also an article tagged with “Android” may be twice as Android-related as another article also tagged with “Android”.
So here’s a solution to this: the Tf-Idf weight, a statistical measure used to evaluate how important a word is to a document in a collection or corpus. With it you can give values to your coordinates that are much more specific than simple ones and zeros. But I’ll leave that for another day.
Also, related to our simple data-set here, perhaps an even simpler metric, like the Jaccard index would be better.
Pearson Correlation Coefficient #
The Pearson Correlation Coefficient for finding the similarity of 2 items is slightly more sophisticated and doesn’t really apply to my chosen data-set. This coefficient measures how well two samples are linearly related.
For example, on IMDB we may have 2 users. One of them, lets call him John, has given the following ratings to 5 movies: [1, 2, 3, 4, 5]. The other one, Mary, has given the following ratings to the same 5 movies: [4, 5, 6, 7, 8]. The 2 users are very similar, as there is a perfect linear correlation between them, since Mary just gives the same rankings as John plus 3. The formula itself or the theory is not very intuitive though. But it is simple to calculate:
^2}{n}) \cdot (\displaystyle\sum_{i=1}^{n} b_i^2 - \frac{(\displaystyle\sum_{i=1}^{n} b_i)^2}{n}) } }")
Here’s the code:
def pearson_score(a, b)
  n = a.length
  return 0 unless n > 0

  # summing the preferences
  sum1 = a.inject(0) {|sum, c| sum + c}
  sum2 = b.inject(0) {|sum, c| sum + c}
  # summing up the squares
  sum1_sq = a.inject(0) {|sum, c| sum + c ** 2}
  sum2_sq = b.inject(0) {|sum, c| sum + c ** 2}
  # summing up the product
  prod_sum = a.zip(b).inject(0) {|sum, ab| sum + ab[0] * ab[1]}

  # calculating the Pearson score
  num = prod_sum - (sum1 *sum2 / n)
  den = Math.sqrt((sum1_sq - (sum1 ** 2) / n) * (sum2_sq - (sum2 ** 2) / n))

  return 0 if den == 0
  return num / den
end


puts pearson_score([1,2,3,4,5], [4,5,6,7,8])
# => 1.0
puts pearson_score([1,2,3,4,5], [4,5,0,7,8])
# => 0.5063696835418333
puts pearson_score([1,2,3,4,5], [4,5,0,7,7])
# => 0.4338609156373132
puts pearson_score([1,2,3,4,5], [8,7,6,5,4])
# => -1
Manhattan Distance #
There is no one size fits all and the formula you’re going to use depends on your data and what you want out of it.
For instance the Manhattan Distance computes the distance that would be traveled to get from one data point to the other if a grid-like path is followed. I like this graphic from Wikipedia that perfectly illustrates the difference with Euclidean distance:

Red, yellow and blue lines all have the same length and the distance is bigger than the corresponding green diagonal, which is the normal Euclidean distance.
Personally I haven’t found a usage for it, as it is more related to path-finding algorithms, but it’s a good thing to keep in mind that it exists and may prove useful. Since it measures how many changes you have to do to your origin location to get to your destination while being limited to taking small steps in a grid-like system, it is very similar in spirit to the Levenshtein distance, which measures the minimum number of changes required to transform some text into another.